The Best Time to Start Your Data Analysis Report? The Answer May Surprise You.
We’ve all been there.
You have gathered all your data, you roll up your sleeves, ready to start your analysis. Finally, you’ll be able to get answers to all your burning questions. However, as you start to review the data, your excitement wanes as you realize that some essential data point is missing.
No big deal, right? You can just dig for more data or ask for another data run.
But after sending off the request and upon further investigation, you return your attention to the data and within a few minutes you find something else is off.
After this happens several times, your enthusiasm begins to flag. You scratch your head and ask yourself, what went wrong?
Analysis Gone Wrong
How do we avoid data re-runs and re-work during analysis?
Not all of us approach report writing the same way. It’s like downhill skiing. We may all start and end in the same general place, but the specific path each of us takes is unique.
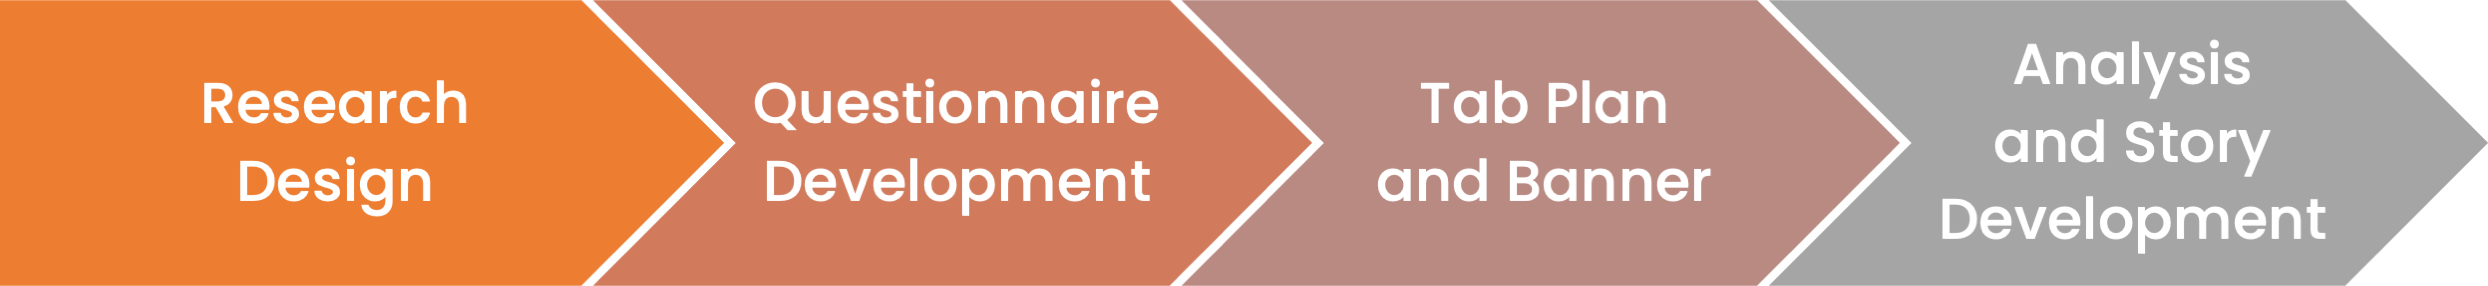
In consumer research, our path starts with design and ends with report. And the approach each of us takes with design, questionnaire development, tab/banner plan, analysis plan, report is different.
However, one of the biggest mistakes is beginning the report writing process only after the data comes in. Analysis and story development need to be infused at every step of the research and data acquisition process.
Although we know this, why doesn’t this happen?
Thinking And Doing: Linear And Non-Linear Approaches
Part of the issue is that some approach research in a very linear way:
Step 1 = design: check!
Step 2 = questionnaire development: check!
Step 3 = tab plan and banner development: check!
Step 4 = analysis: check!
And to a certain extent, consumer research will always require linear thinking because it happens over time, which is (of course) linear.
However, one solution to the stop-and-go approach to analysis described earlier is by shifting toward a non-linear process. This not only minimizes the need to rerun data, it makes our storytelling and analysis stronger.
Think of 1) linear time as doing and 2) non-linear time as thinking.
Linear Process - Doing
Linear Process:
Thinking about each research component as a single step in a linear path causes the biggest issues. It’s a “conveyor belt” approach, which doesn’t lend itself to agility when things begin moving too fast.

Non-Linear Process - Thinking
Non-Linear Process:
Deep thinking is required for analysis and story development. Each component of the research process (questionnaire development, tab plan, banner) informs the other. Meaning that one cannot be thought of in isolation without the other. They work together.

All components of the research process need to be considered in unison when developing the analysis, so “report writing” begins with research design and continues throughout the entire research process.
Let’s take a look at each research step and what to consider for a meaningful and actionable analysis.
Good Design Begets Good Analysis
Good research design is based on having a strong understanding of both business and research objectives. Critical questions grappled with in design:
Define the problem: What problem are we trying to solve?
Provide context: What is the context of the situation surrounding the immediate problem? What do we already know?
Define participants: Who should we talk with? Why? Are there particular subgroups of interest?
Identify base size: How many interviews should we complete in order to feel confident in results?
Test hypotheses: How can we test our hypothesis? How can we avoid our hypotheses biasing our design?
Questionnaire: Put Yourself in Your Consumer’s Shoes
Unlike qualitative research which puts you in the room with consumers, quantitative research requires more foresight because you can’t modify the discussion based on what you’re learning.
With quantitative research, it’s critical to put yourself in the consumer mindset when developing the questionnaire. You need to anticipate how they will interpret and respond to questions. It not only makes the data more reliable but makes for a better experience for those engaged in survey taking.
Here are a few things to consider:
Question order: What questions do you need to ask in order to address objectives? How should they be ordered?
Wording clarity: Where is there ambiguity in questions and answer sets?
Questionnaire flow: How does question order and skip patterns impact results?
Tab Plan & Banner: Data Structure Simplifies Analysis Process
A well-thought-out tab plan and banner gives you the freedom to focus on generating your story, rather than data reruns.
One of the most critical steps in ensuring a strong analysis is developing the tab plan and banner in conjunction with the questionnaire. This helps you realize if you’re missing anything—which will only make your analysis sounder.
Key questions to develop a strong tab plan and banner:
Envision your story: How do you envision that you’ll build your story?
Understand data needed to tell your story: How will you leverage this data in your story development?
Identify consumers important for your story: What demographic groups will be essential to look at? Brand users/non-brand users? Competitive brand users?
Analysis & Story: Culmination of Careful Planning
Often, at the end of the project, we’re short on time to finish the analysis. Targeted planning up front allows more time to focus on what’s important—grasping the meaning behind the data and developing the story.
Constant interruptions are unwelcomed, and although some people have come to accept that as part of the process, it can be minimized with planning.
Key points to consider during the analysis phase:
Revisit objectives: The problem you’re trying to solve and the reason you engaged consumers provide a blueprint for the analysis.
Test your hypothesis: Check whether or not your hypotheses hold water, and let your story unfold based on the way the data directs you.
Find the big idea: Make connections and flesh out the big idea.
Use precise language: Be certain that the way you talk about results is accurate, in terms of who the people are, what they think, etc.
Final Thoughts: More Planning, Less Pain
Avoid the conveyor belt approach to report writing and incorporate non-linear thinking into your research process.
Questionnaire development: Revisit objectives and put yourself in consumer’s shoes.
Tab plan and banner: Envision your data needs with a well-thought-out tab plan and banner at the same time you develop your questionnaire.
Analysis & story development: Review objectives, find the story, and ensure you’re accurately representing consumers and context.
Will doing all this help you avoid all last-minute data requests? Of course not. But it will minimize them and give you more time to focus on what matters—developing strong persuasive stories.